
What is the Bacterial Growth Curve?
When you inoculate, or transfer bacteria onto media(a substance that gives them a nutritious source of "food" such as a broth tube or agar plate, there are different sets of nutrients you can use), you may notice that the bacteria seem to appear overnight! You start out with hardly anything, and leave your tube or plate on the shelf. When you come back in the next day or two, what do you see? Your broth is turbid (cloudy, indicating that bacteria are present), or there are colonies(visible clumps of bacteria) on your plate. How does this happen?
As bacteria grow(remember, growth refers to how cells divide and create more copies of themselves), their numbers follow a certain pattern. This pattern is known at the bacterial growth curve. There are four phases: lag phase, log/exponential growth phase, stationary phase, and death/decline phase. To plot the data and create the graph, we count or approximate the number of viable(living) cells at different points in time, then plot the logarithm of that number for each phase. Time is on the x-axis, and logarithm of living cells is on the y-axis. The graph appears as a flat line followed by a steep upward line, another flat line higher up, and finally a gentler downward line.
The lag phase begins when you place your bacteria on your media. The cells are just getting used to their new environment. They're busy figuring out what nutrients are available, and what they should do to get the energy they need to grow. They haven't started multiplying yet! This phase can last from one hour up to a few days, depending on conditions.
The log, or exponential growth phase comes next- this is when bacteria start growing/multiplying as fast as they can! They have plenty of food and space available. This phase is usually over pretty soon.
After that, the stationary phase begins. Our bacteria have started to run out of "food", and they're getting crowded. They essentially stop multiplying, as resources are limited. As if that wasn't bad enough, the metabolic waste they produce starts to build up...
If you leave your culture out for long enough, the media runs out of nutrients, and bacteria are overwhelmed by their own waste products. How gross is that? Due to these circumstances, cells start dying off, marking the death phase. Not to worry, you can keep your bacteria going by transferring some of it to a fresh new plate or tube- they will start the cycle all over again!
Now, you may be wondering what is the point of tracking this information. You're mainly learning about how well the bacteria multiply on a given media(set of nutrients), right? It is useful if you are trying to obtain larger numbers of a certain bacteria for research purposes. By tracking growth on different media, you can determine which nutrients the species prefers- which "food" yields the highest growth! Also, if you're investigating how different bacteria can degrade a pollutant like oil or plastic, you're interested to see if it can metabolize the pollutant or use it for energy. You may track the growth curves of various species of bacteria on the pollutant, see which species has the highest growth and use that one for your bioremediation purposes. Bioremediation refers to using microbes to break down contaminants/pollutants!
This highlights the importance of making good observations and carefully plotting your data, no matter which scientific process you're working with!
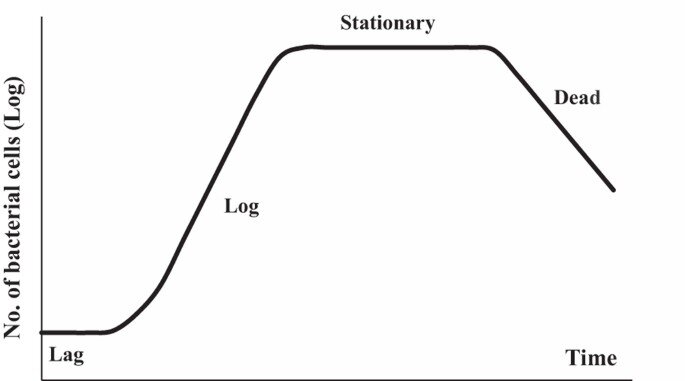
Phases of the bacterial growth curve.
Picture Source: nature.com